
Every Health Record I Own, in One Repo an AI Can Read
My blood panels lived in email attachments. My DEXA scan lived on a disc from the radiology clinic. WHOOP had its own app, the blood pressure cuff had another, the DNA report was behind a login I hadn't used in a year, and the abdominal ultrasound was a sheet of paper in a drawer.
Every doctor I saw got one slice of that, for about twelve minutes, with no history.
So in March I started putting all of it into a single git repository. It's now the only place I look, and what surprised me is how much was sitting in the gaps between the sources.
Updated October 2026. The dashboard went from seventeen pages to six, I stopped logging food year-round, and the repo started tracking whether I actually do what it recommends. The sections below describe the setup as it runs now.
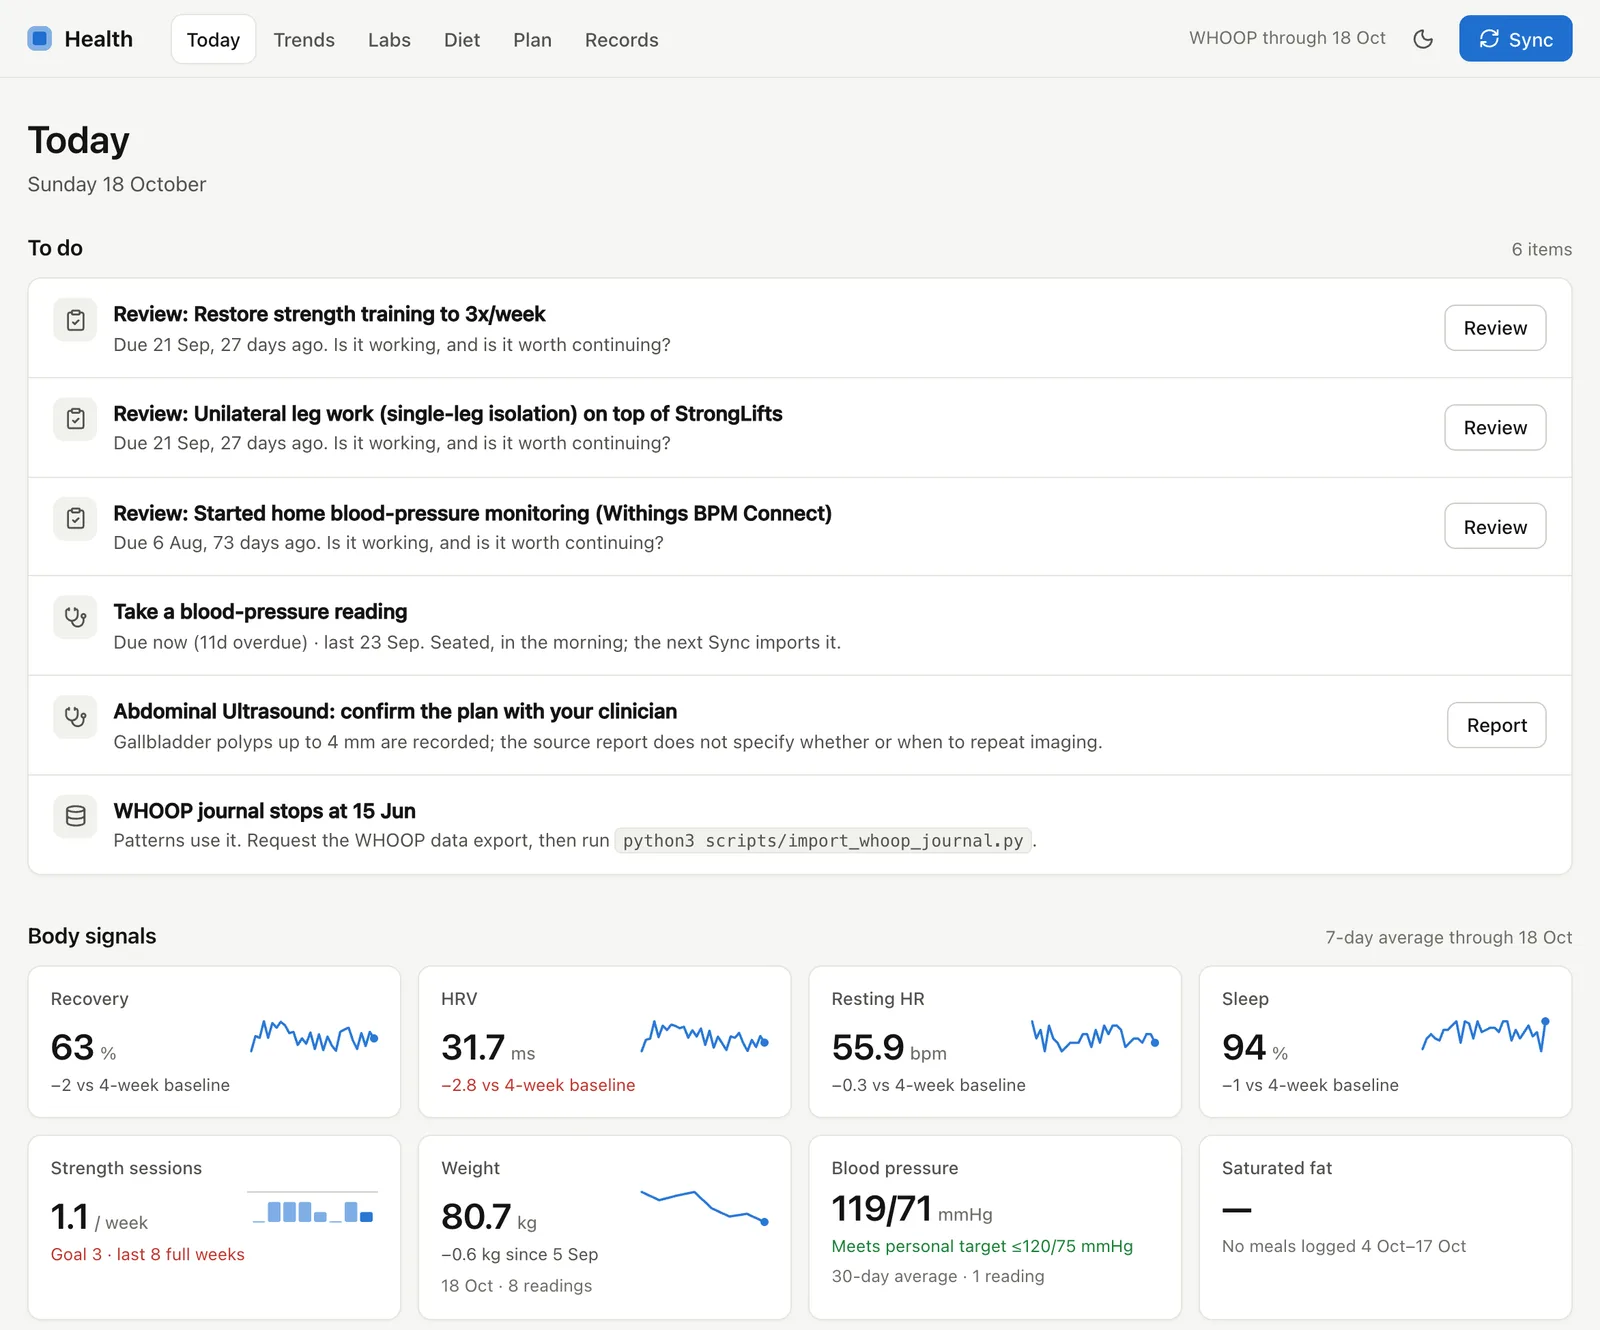
Six sources, six viewers, no shared time axis
Nothing I collected was hard to get. Labs come as PDFs. WHOOP and Withings have APIs. The DEXA clinic hands over DICOM files if you ask. Consumer genomics exports a raw text file.
The problem is that each one is a silo with its own viewer and its own idea of time. You cannot ask an app that only holds heart rate whether your cholesterol trend lines up with your training volume. You cannot ask a lab portal what your body composition looked like on the day of the draw.
And a general practitioner, however good, is looking at whatever you handed them that morning. Mine has never seen four years of panels side by side, because until recently neither had I.
Plain files, because that's what models read best
The whole thing is markdown and JSONL in a directory tree:
data/        normalized facts, append-only
sources/     original PDFs and DICOMs, kept for provenance
analysis/    assessments, open questions, recommendation log
context/     profile, preferences, family history
memory/      timeline, interventions
scripts/     importers and validators
Python importers pull WHOOP and Withings and parse the DEXA DICOMs. New medical PDFs go into sources/, and the agent turns them into structured records. A local FastAPI backend and a React frontend show it in a browser on six pages: Today, Trends, Labs, Diet, Plan and Records. None of it is deployed anywhere. It runs on my laptop and the repo stays private.
I chose files over a database for one reason: models read files well. Point Claude at the directory and it can hold labs, scans, wearable history, diet, and my family history in the same context and reason across all of them. No query layer, no schema translation, no API. The same property makes it durable - in ten years the JSONL will still open, which is more than I'd bet on any health app I could have signed up for.
Git does the rest. Every record is append-only, every change is a diff, and history is free.
Three fields carry the whole design: source_date for when the thing happened, imported_at for when it entered the repo, fetched_at for API pulls. It sounds trivial. It's the difference between a trend you can trust and a pile of numbers with ambiguous timestamps, and it's the first thing a model will get wrong if you don't force it.
What consolidation actually surfaced
This is the part I'd have been skeptical about before doing it.
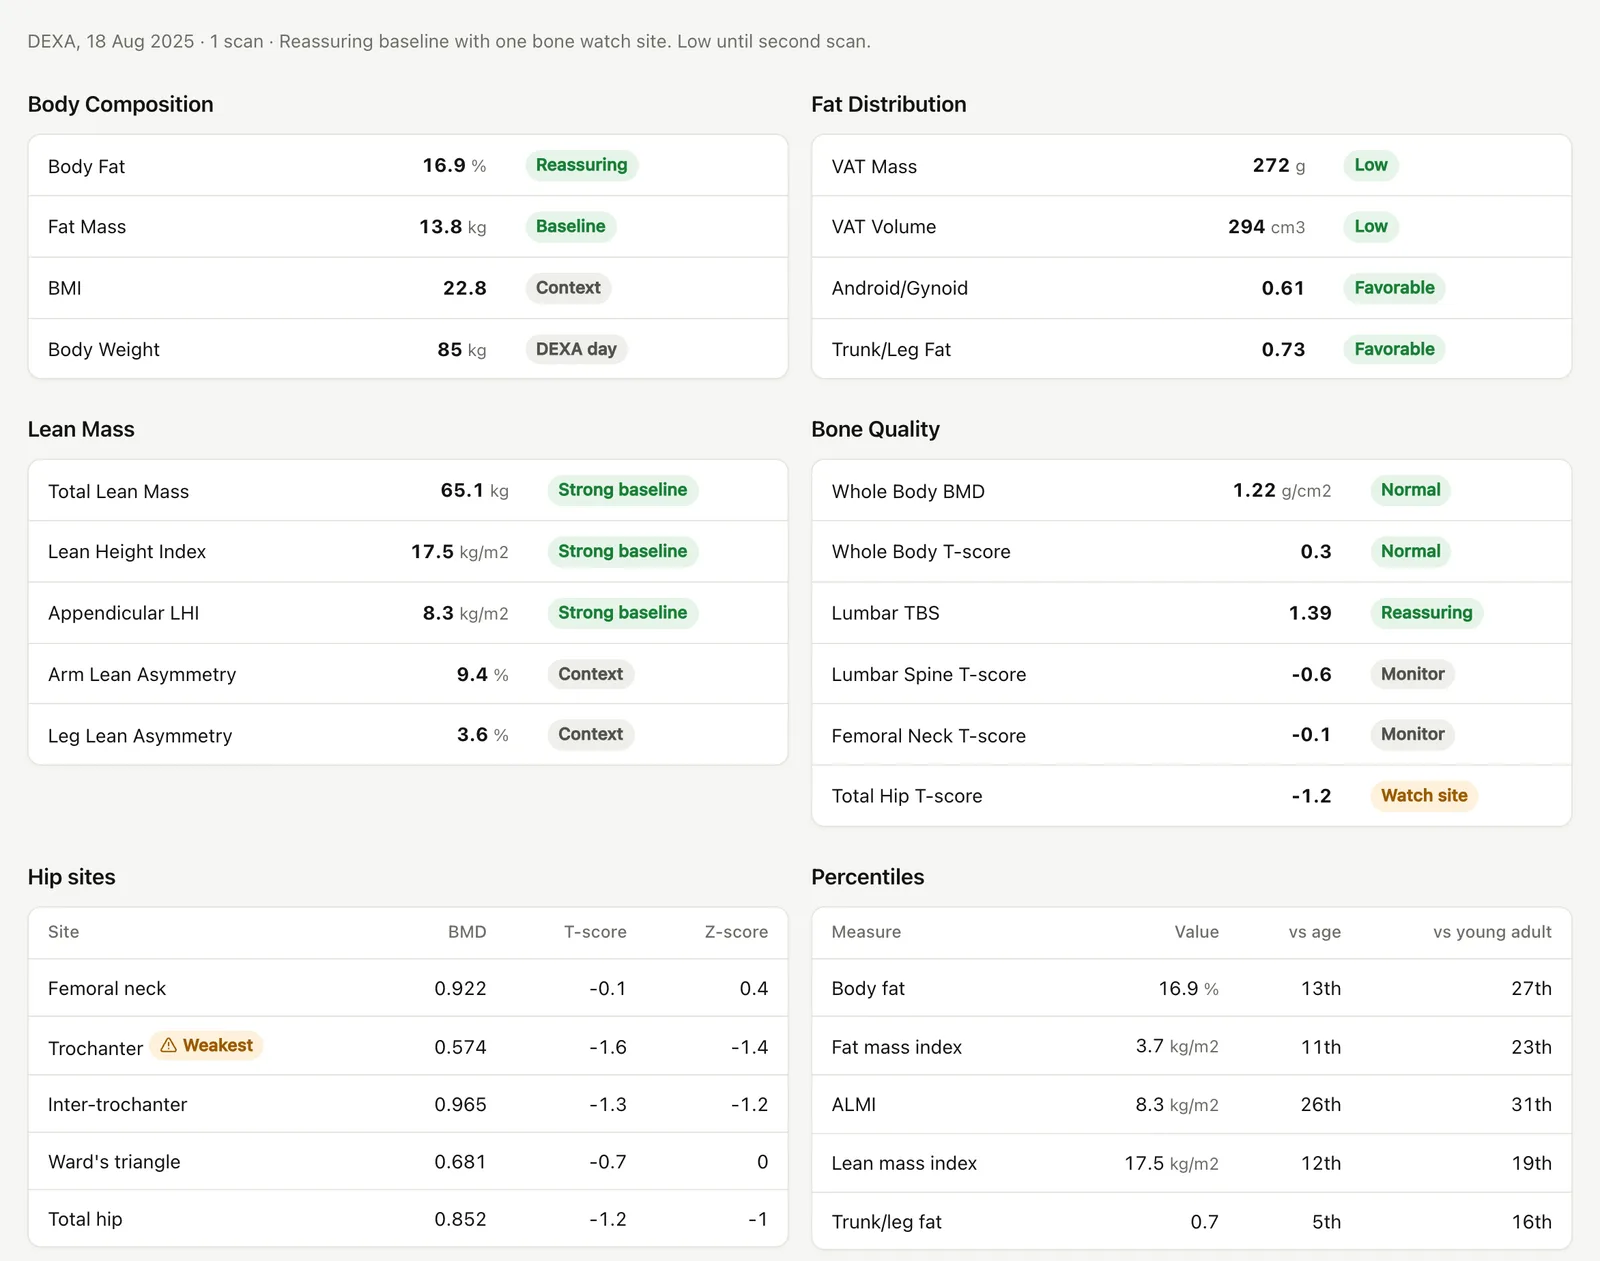
The DEXA report said my bone density was normal. It is, at the summary level. But re-extracting the original Hologic DICOM files gave me the hip sub-sites, and the trochanter sits at T -1.6 while total hip is -1.2. That's a specific weak site, which implies specific loading, which is a completely different conversation than "bone density normal." The clinic handed me a file with all of that inside it. What they printed was one reassuring line.
A creatinine trend that would have looked like nothing. Across three draws at two different labs, creatinine went 1.0 → 1.3 and eGFR fell from 96 into the low 70s. At any single appointment that's a shrug and a comment about muscle mass. In the repo it became a tracked question with the confounders written down explicitly - lifting, hydration, body size - and a note that the honest answer needed a repeat measurement plus cystatin C. The June panel came back at 1.1 with eGFR 84. The confounding explanation held. Cystatin C is queued for the next draw anyway, because it doesn't depend on muscle mass and would settle the question.
The mismatch nobody sees, because nobody holds both files. Total cholesterol ran up to 240 and LDL to 140 across the panels, while body fat sat at 16.9% at BMI 22.8 and every glycemic marker stayed normal. That combination is the actual signal: the lipids aren't explained by adiposity or insulin resistance, so they need their own explanation. You only see the mismatch if the DEXA and the labs live in the same place. The most recent panel finally bent the trend - 223 total, 136 LDL, ApoB flat at 0.95 - and with four baselines on file I could see it was a real reversal.
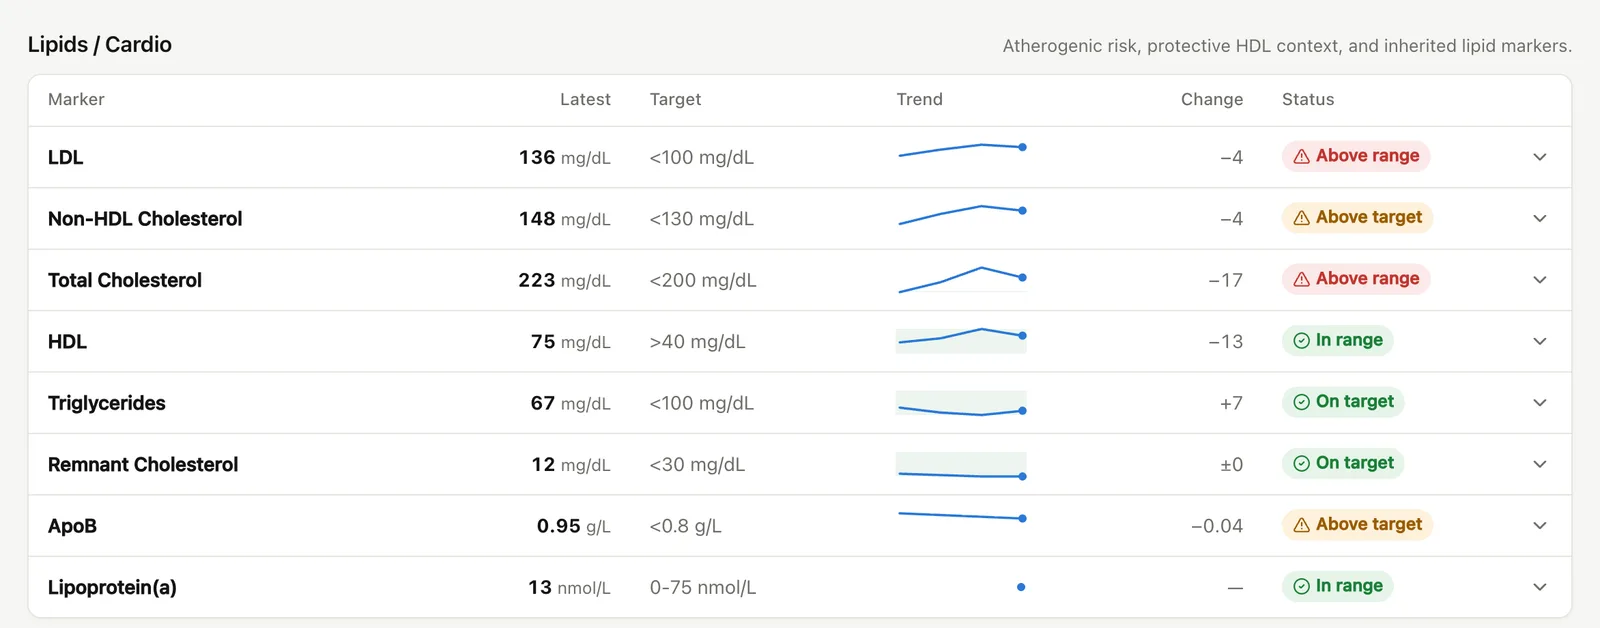
Every marker carries my own prevention target alongside the lab's reference range, which matters more than it sounds. The lab calls ApoB 0.95 g/L "in range." My target is under 0.8. That gap is the entire reason ApoB is now the endpoint I track.
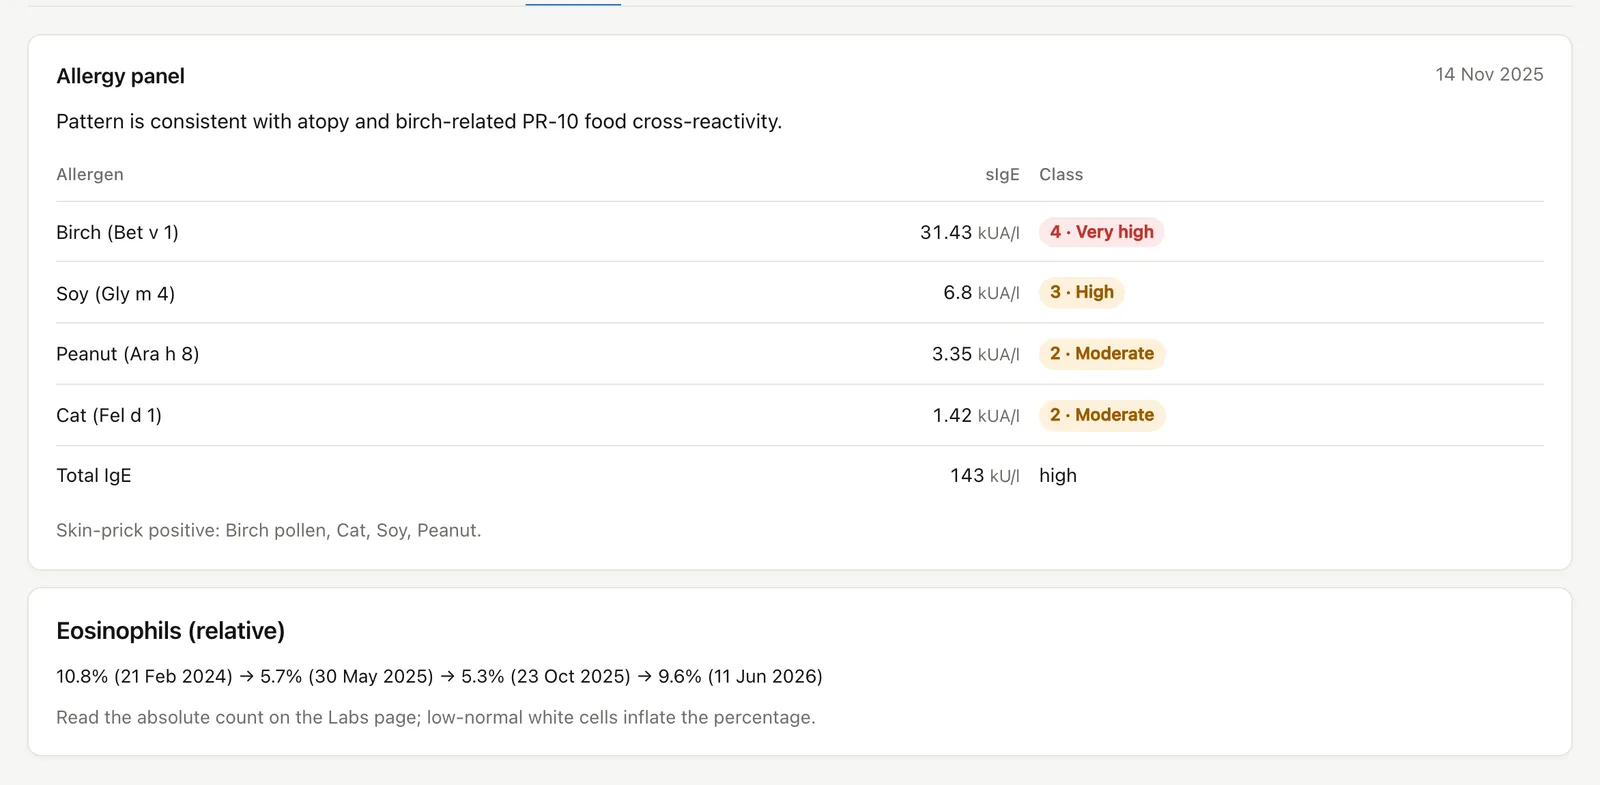
Eosinophils that were high on every single draw. Each individual panel flagged them and moved on, because one elevated eosinophil count with allergies in the chart is unremarkable. Four draws in one place tell a different story: elevated every time, over two years, with the IgE workup sitting next to them showing class 4 birch sensitization and PR-10 cross-reactivity to soy and peanut. The repo also knows when birch season peaks here, so the draws can be read against pollen timing.
Genomics, downgraded honestly. The consumer report gave me a confident APOE label. Checking the raw file showed rs7412 as T/C, which confirms one e2 allele, while rs429358 is a no-call on one chip and absent from the other. So what the repo stores is "e2 carrier, e4 status unresolved" - messier than the report's version, and true. Most of that vendor's broad disease-risk output is now explicitly ranked as weak background context, which is roughly what it deserves.
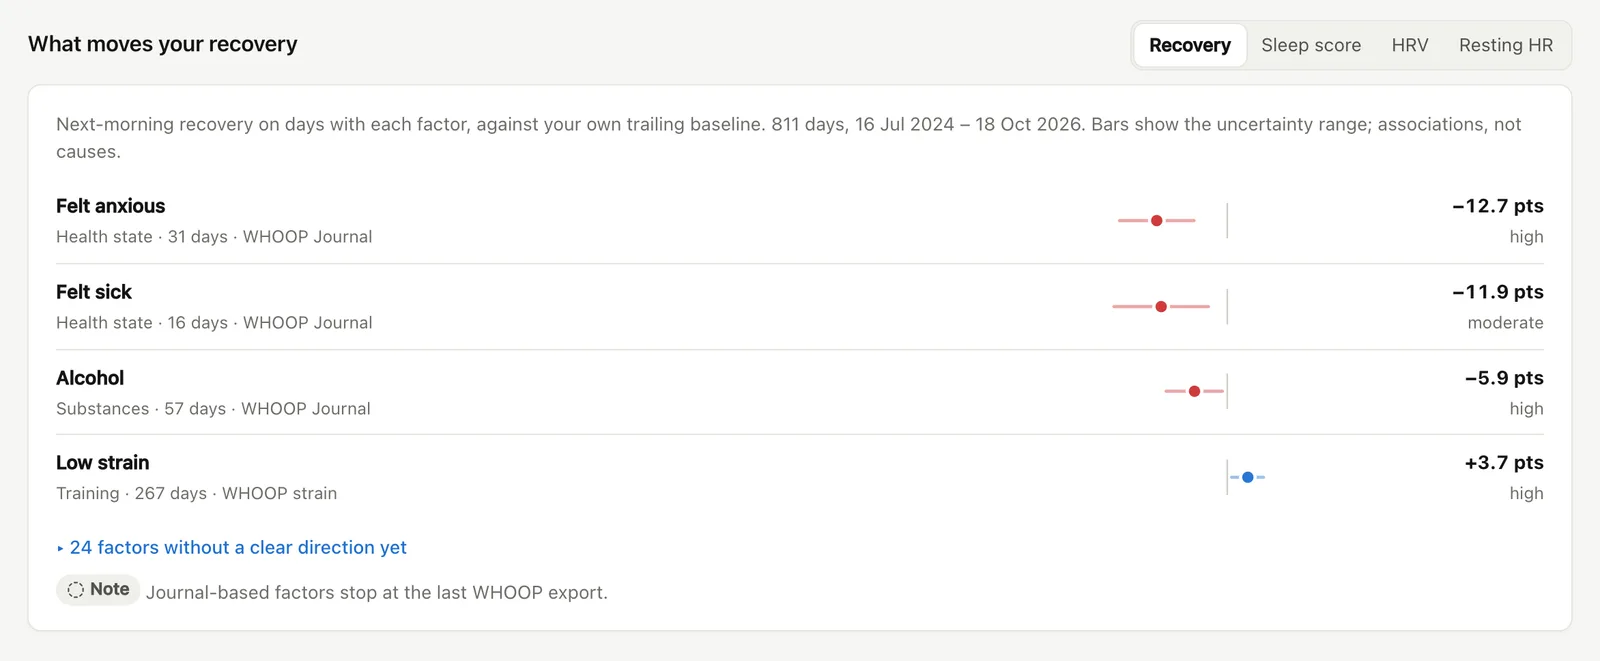
Two years of WHOOP against my own journal. I backfilled WHOOP to July 2024, which gives 811 days of next-morning recovery to compare with the daily journal questions. Each factor is measured against my trailing 28-day baseline rather than against all other days, because otherwise the comparison partly measures which season or training block I was in. With that correction, alcohol costs about 6 recovery points (57 days, interval -11 to -1). Ashwagandha, logged on 92 days, lands at -5 with an interval that crosses zero, so it sits under "no clear direction yet" and I don't get to claim it did anything. The journal only refreshes when I request a WHOOP account export, so rows that stop updating are labeled instead of looking current.
None of these are diagnoses. They're questions worth asking, and I now walk into appointments with them already written down.
The repo caught me skipping my own plan
Findings are the easy half. The harder half is doing something about them and checking whether it worked.
In July the recommendation was to get barbell work back to three sessions a week. I told the repo I was back on it, and the recommendation log still says "user-confirmed". WHOOP disagrees. Over the last eight full weeks I averaged 1.1 sessions: 0, 0, 2, 2, 2, 1, 0, 2.
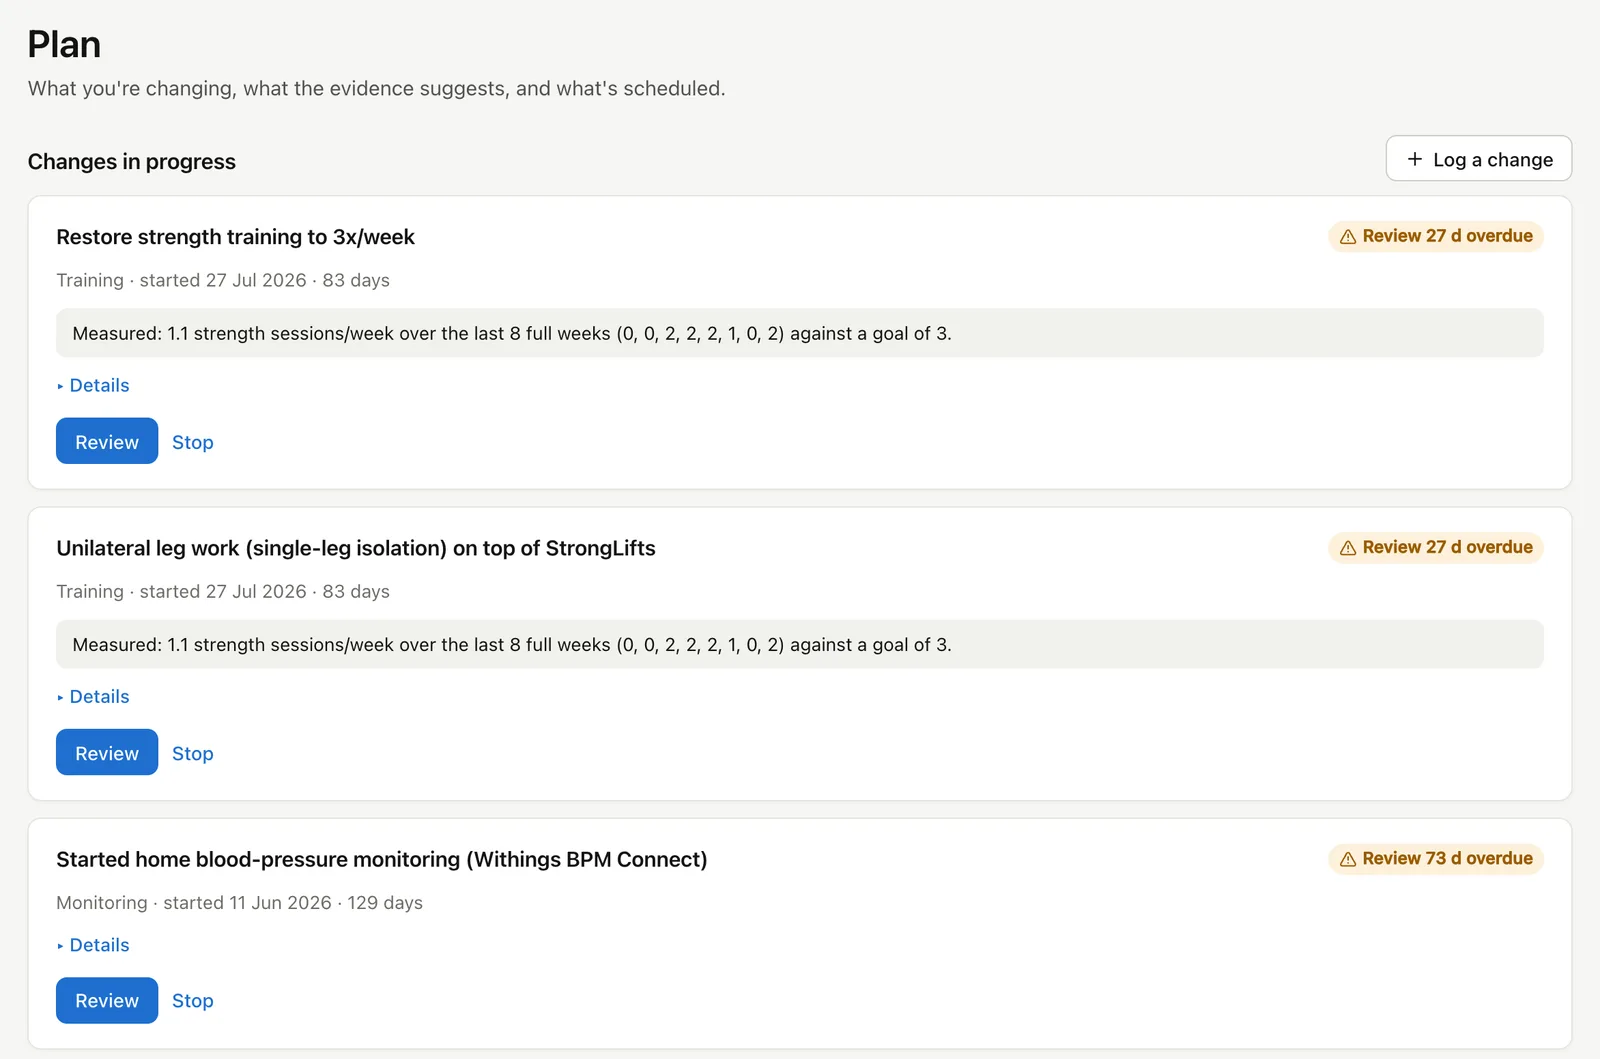
So every change I log now gets a review eight weeks after it starts. Where the data can measure it, the measurement sits next to the intent. An overdue review goes to the top of Today and into the weekly digest, which asks one question: continue, adjust, stop, or collect more evidence. Writing a change down turned out to be half the loop. The other half is the repo asking whether it happened.
Food: I failed again, so I asked when it matters
Labs arrive as numbers. Food arrives as a shopping trip and a plate. The hard part turned out to be adherence: I had quit food tracking every previous time I tried it.
Every attempt died in the same place. The app wants you to search a database and type grams, at the moment you are hungry and holding a fork. Call it forty seconds per meal. That's nothing, right up until you multiply it by every meal for the rest of your life, and then one busy week ends it permanently.
So I designed backwards from the friction. The capture step is a photo into a shared album, and optionally one word in the comment. Everything else moved to the model. I say sync diet, and it reads the new album items, works out whether each one is a barcode, a meal, a sequence of ingredient shots or a run of kitchen-scale readings, estimates calories and macros with an explicit range, and appends rows. No comment on a packaged product means I ate the package. half or 250 ml overrides it.
It worked for sixteen days. From July 28 to August 13 I photographed nearly everything, and saturated fat came in over my 22 g cap on ten of those days. Then a busy week came and logging stopped, exactly like every time before.
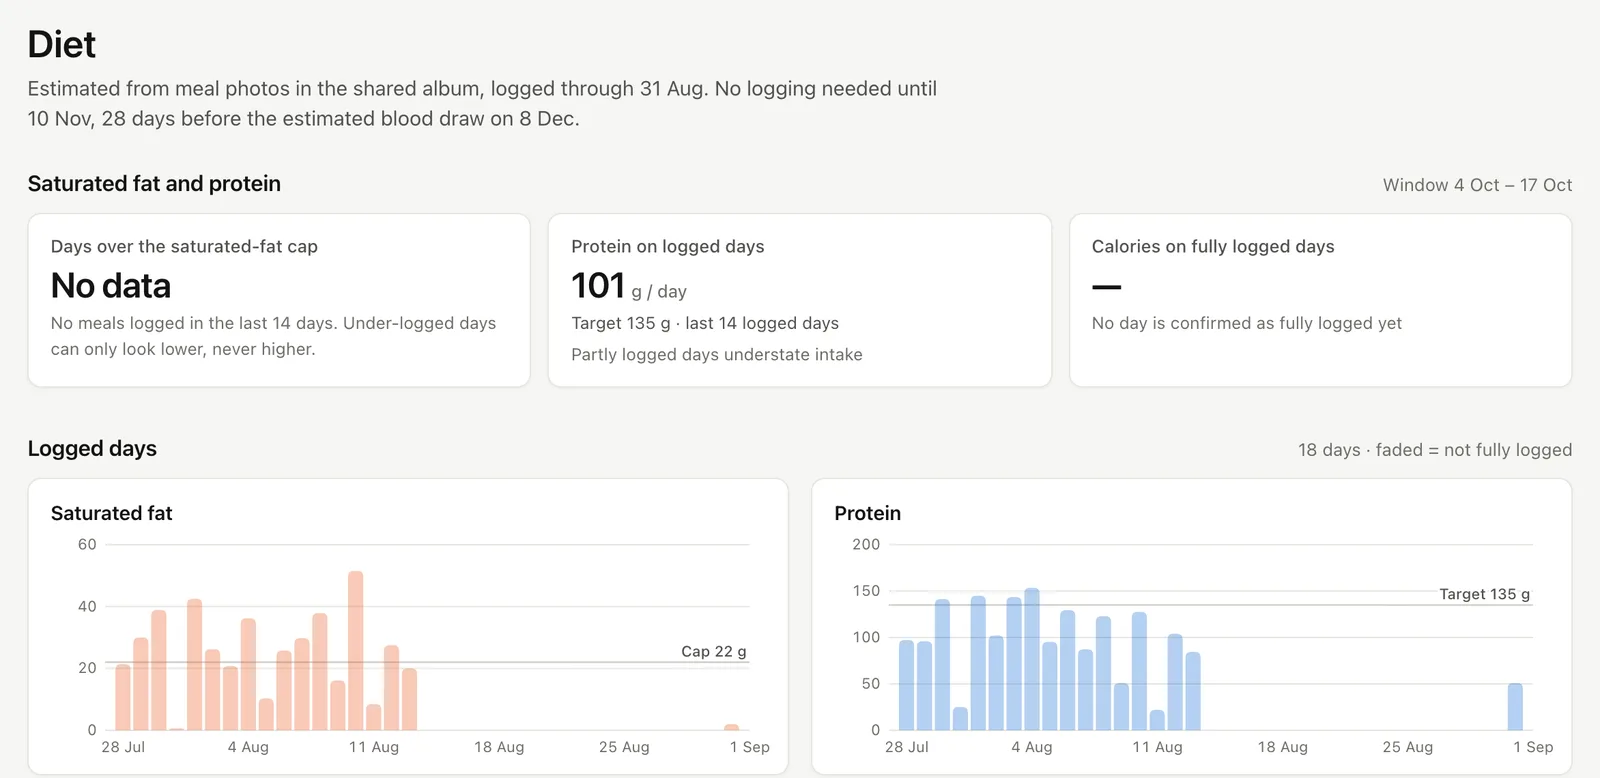
The fix was a question I should have asked first: when is this data actually used? Meals matter here because they might explain a change in ApoB or LDL. A lipid change can only be put down to diet if the weeks before the draw were logged. Food from June says nothing about a December panel.
So the dashboard now asks for photos only in the 28 days before the next blood draw. I enter the booked date on the Labs page, and until then it estimates the date from my usual draw cadence. Outside that window nothing nags about an old meal log. The next one opens on November 10. Inside it, I sync once a week and answer one question: which days were fully photographed?
That answer matters because missing photos only ever push the numbers down. A day over the saturated-fat cap counts even if it was partly logged. A day under the cap counts only if it was fully logged; otherwise it's inconclusive. And the cap is read as a window - how many of the last 14 days went over - because one day can't show a pattern.
I also dropped the grocery receipts. They were meant to be a second, passive stream: what the household bought, as energy-adjusted ratios, never added to what I ate. In practice nothing read them. They came off the dashboard on August 5, and an audit later found the backend still computing them into every response. The importer and twelve weeks of history stay on disk in case I want the series back.
The trade is still accuracy for adherence. A photographed meal comes back as 480 kcal with a 380-620 range, which no food scale would accept. But four honest weeks before each draw beat a year-round log that lasted sixteen days, and for the question I'm asking - did the weeks before this panel look different from the weeks before the last one - a range is good enough.
What I'd tell someone starting
Start with the PDFs you already have. Four blood panels in one file beats a perfect ingestion pipeline you haven't built.
Get the timestamps right before anything else, and append. A corrected value should be a new record carrying its reason, so the old one stays visible.
Before asking yourself for daily data, find the question it answers and when you'll ask it. My food log only needs to exist four weeks before a blood draw. Logging everything all year got me sixteen days.
Delete what nothing reads. Models make features cheap to add, so the cost moves to keeping them alive. An audit against actual usage removed an appointments feature with three rows ever written against eight endpoints, and an indoor-air source that pointed at a file no script could write. The dashboard went from seventeen pages to six.
Write down uncertainty as a first-class record. My repo has a debate queue: open questions, current best guess, and what evidence would change the answer. It's the file I reread most, and it's what keeps the whole exercise from turning into a machine for confirming what I already believed.
And be clear about what this is. It doesn't replace a physician and it hasn't diagnosed anything. It makes those twelve minutes better, and when something does drift I should see it in a trend long before I feel it as a symptom.
Building your own, or want to argue about the diet schema? me@eone.work. The related reading is Debugging Your Body, which is why I started collecting any of this.
Other Posts
View allLearning to Fly: Starting My PPL
Why I'm chasing a private pilot license, and what my first flight - first takeoff included - actually felt like.
Building a Game About My Hometown Without Writing Code
How I built a Soviet-era city builder about Aktau using Claude Code, Cursor, and Suno AI - all without touching the code.
Debugging Your Body: What Longevity Research Taught Me About Systems Thinking
How "Why We Sleep" and "Outlive" changed my approach to health - and why optimizing for longevity feels a lot like maintaining production systems.